Published on: February 22, 2022 - https://doi.org/10.2110/palo.2021.012
Thalassinoides is a trace fossil with a wide distribution in siliciclastic and carbonate strata. In many parts of the world, Thalassinoides-bearing strata contribute to the permeability of hydrocarbon reservoirs and water aquifers. Examples of hydrocarbon reservoirs with Thalassinoides include (1) the Arab-D reservoir in the Middle East, (2) chalk reservoirs in the North Sea, and (3) the Wabamun Group strata in central Alberta, Canada. The quality of such reservoirs and aquifers is mainly determined by Thalassinoides attributes, such as burrow infill, size, shape, and morphology; but, the burrow percentage in the Thalassinoides-bearing strata is crucial to understand the impact of this burrow on reservoir and aquifer quality.

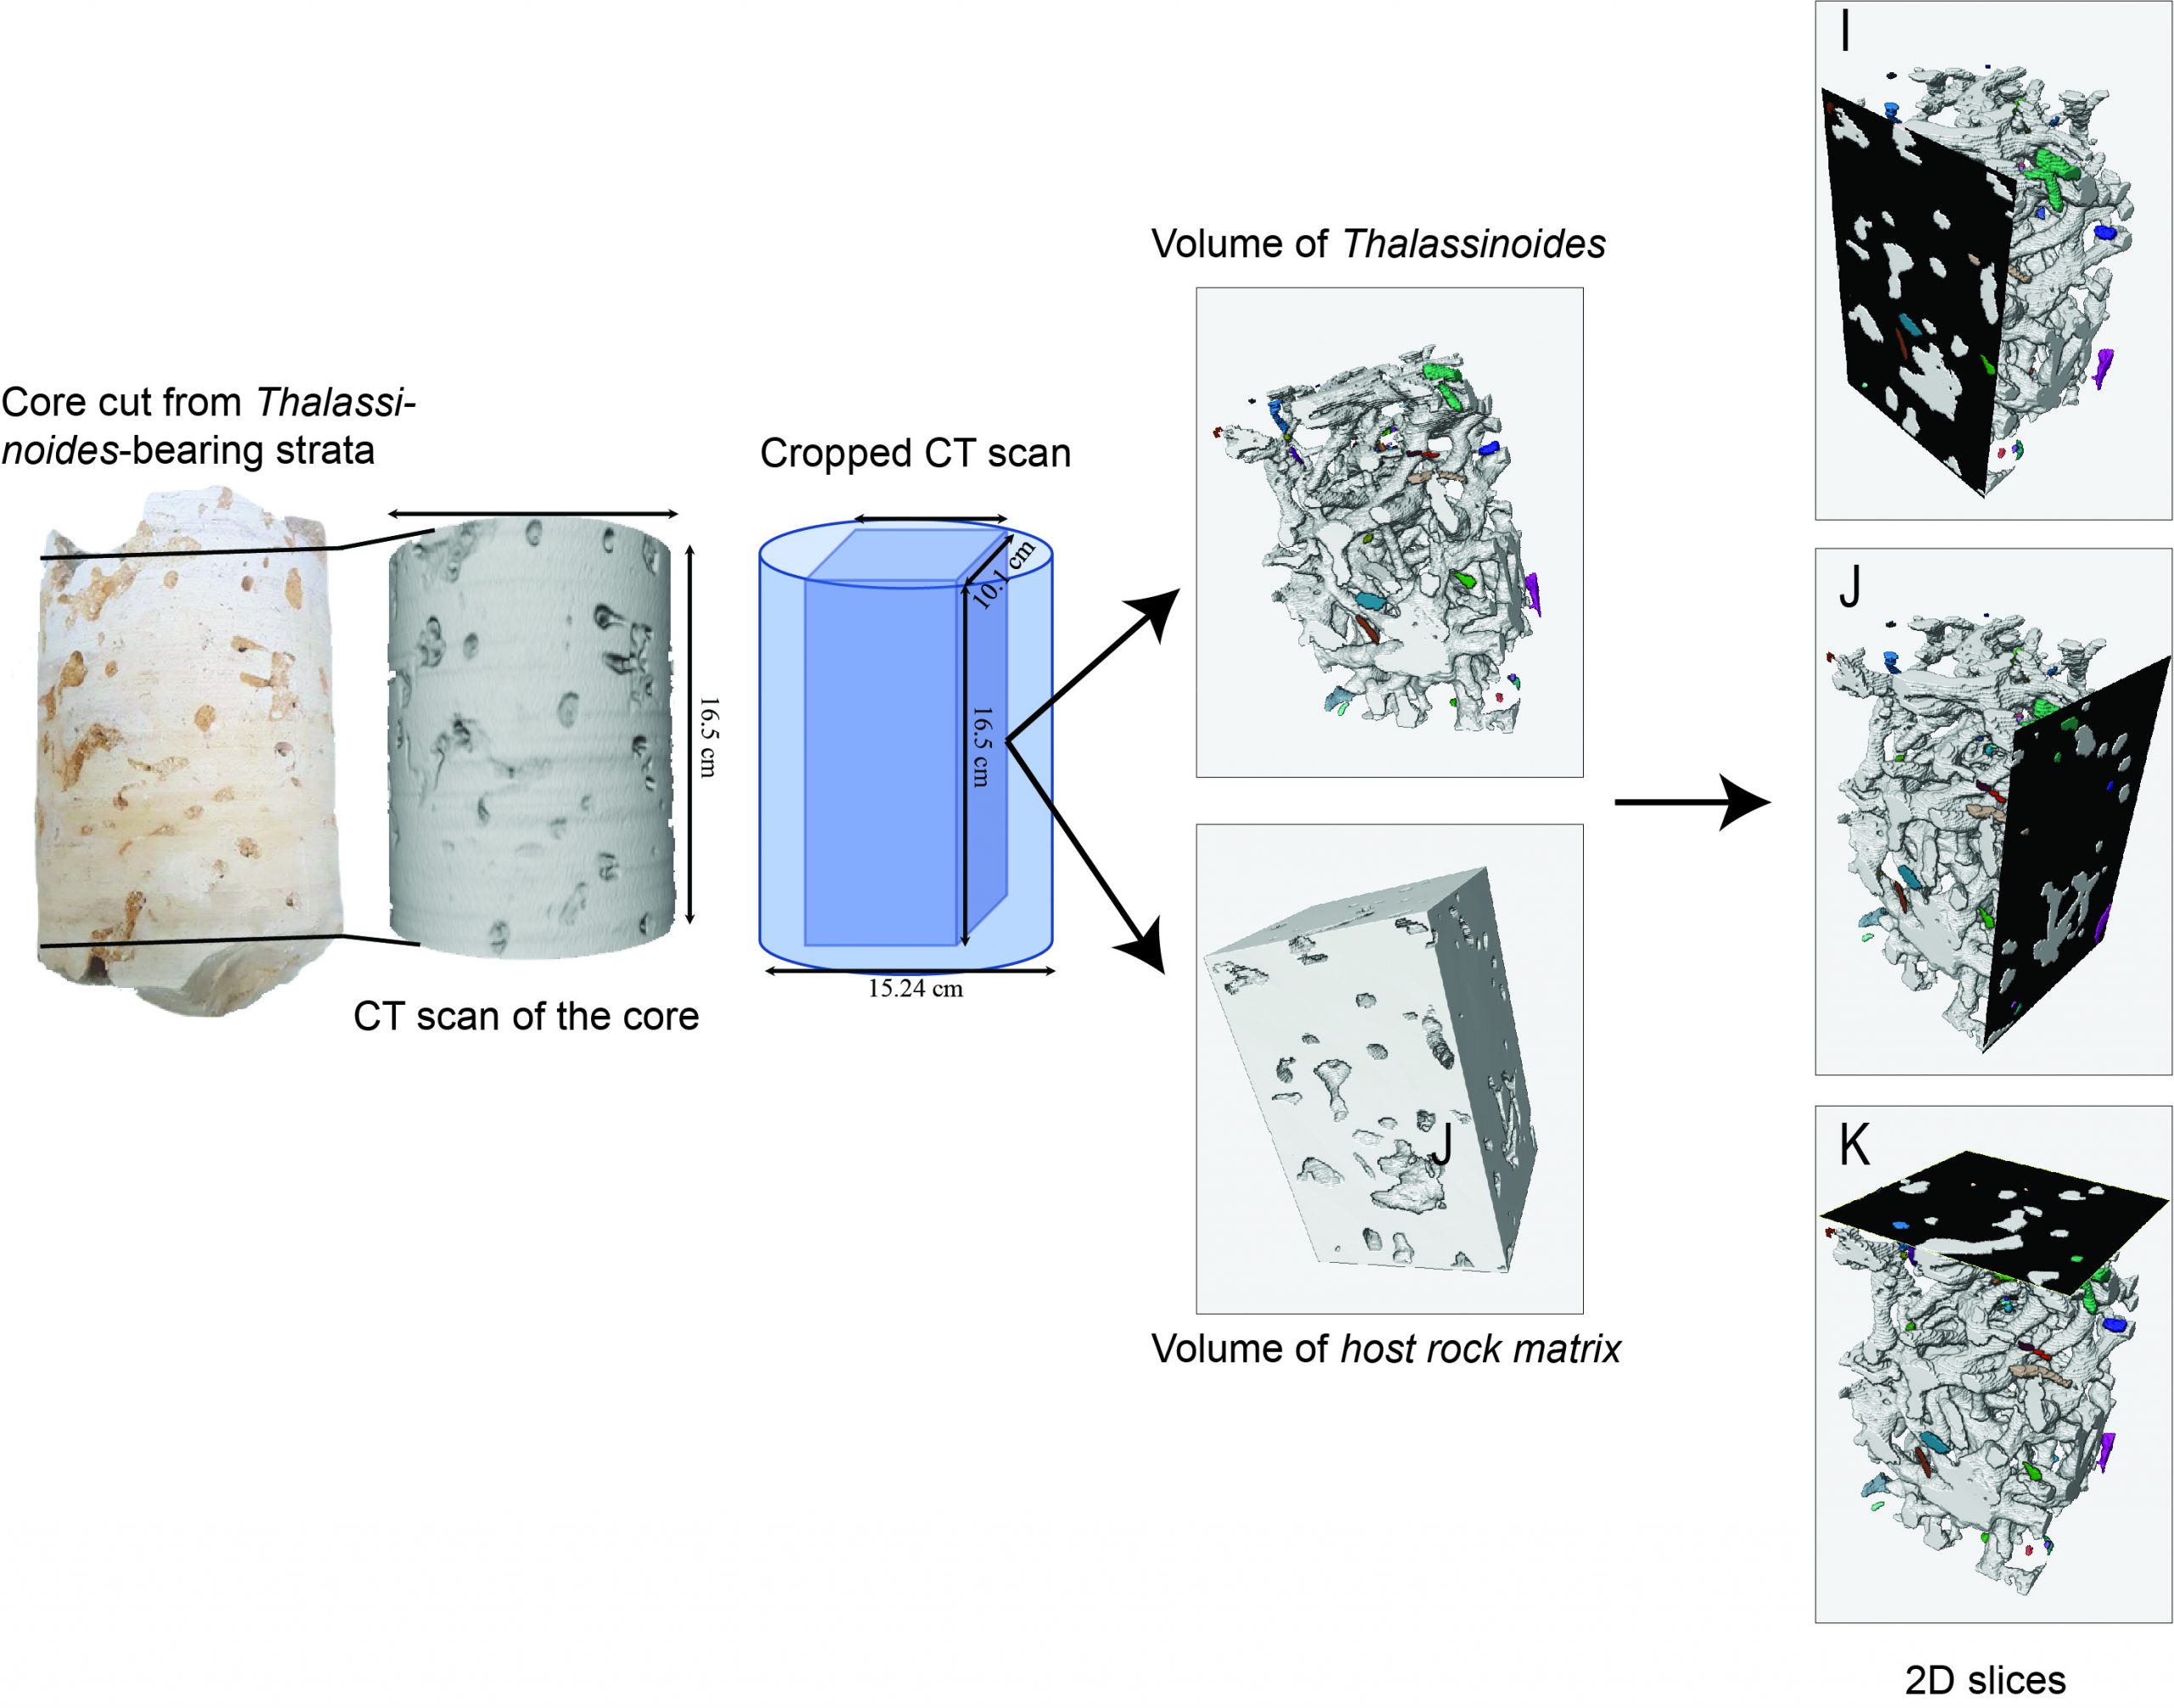
Fig1: Core Cutting and Scan illustration. Screen captures of the cropped quadrangular prism showing 2D views of Thalassinoides with different orientations.
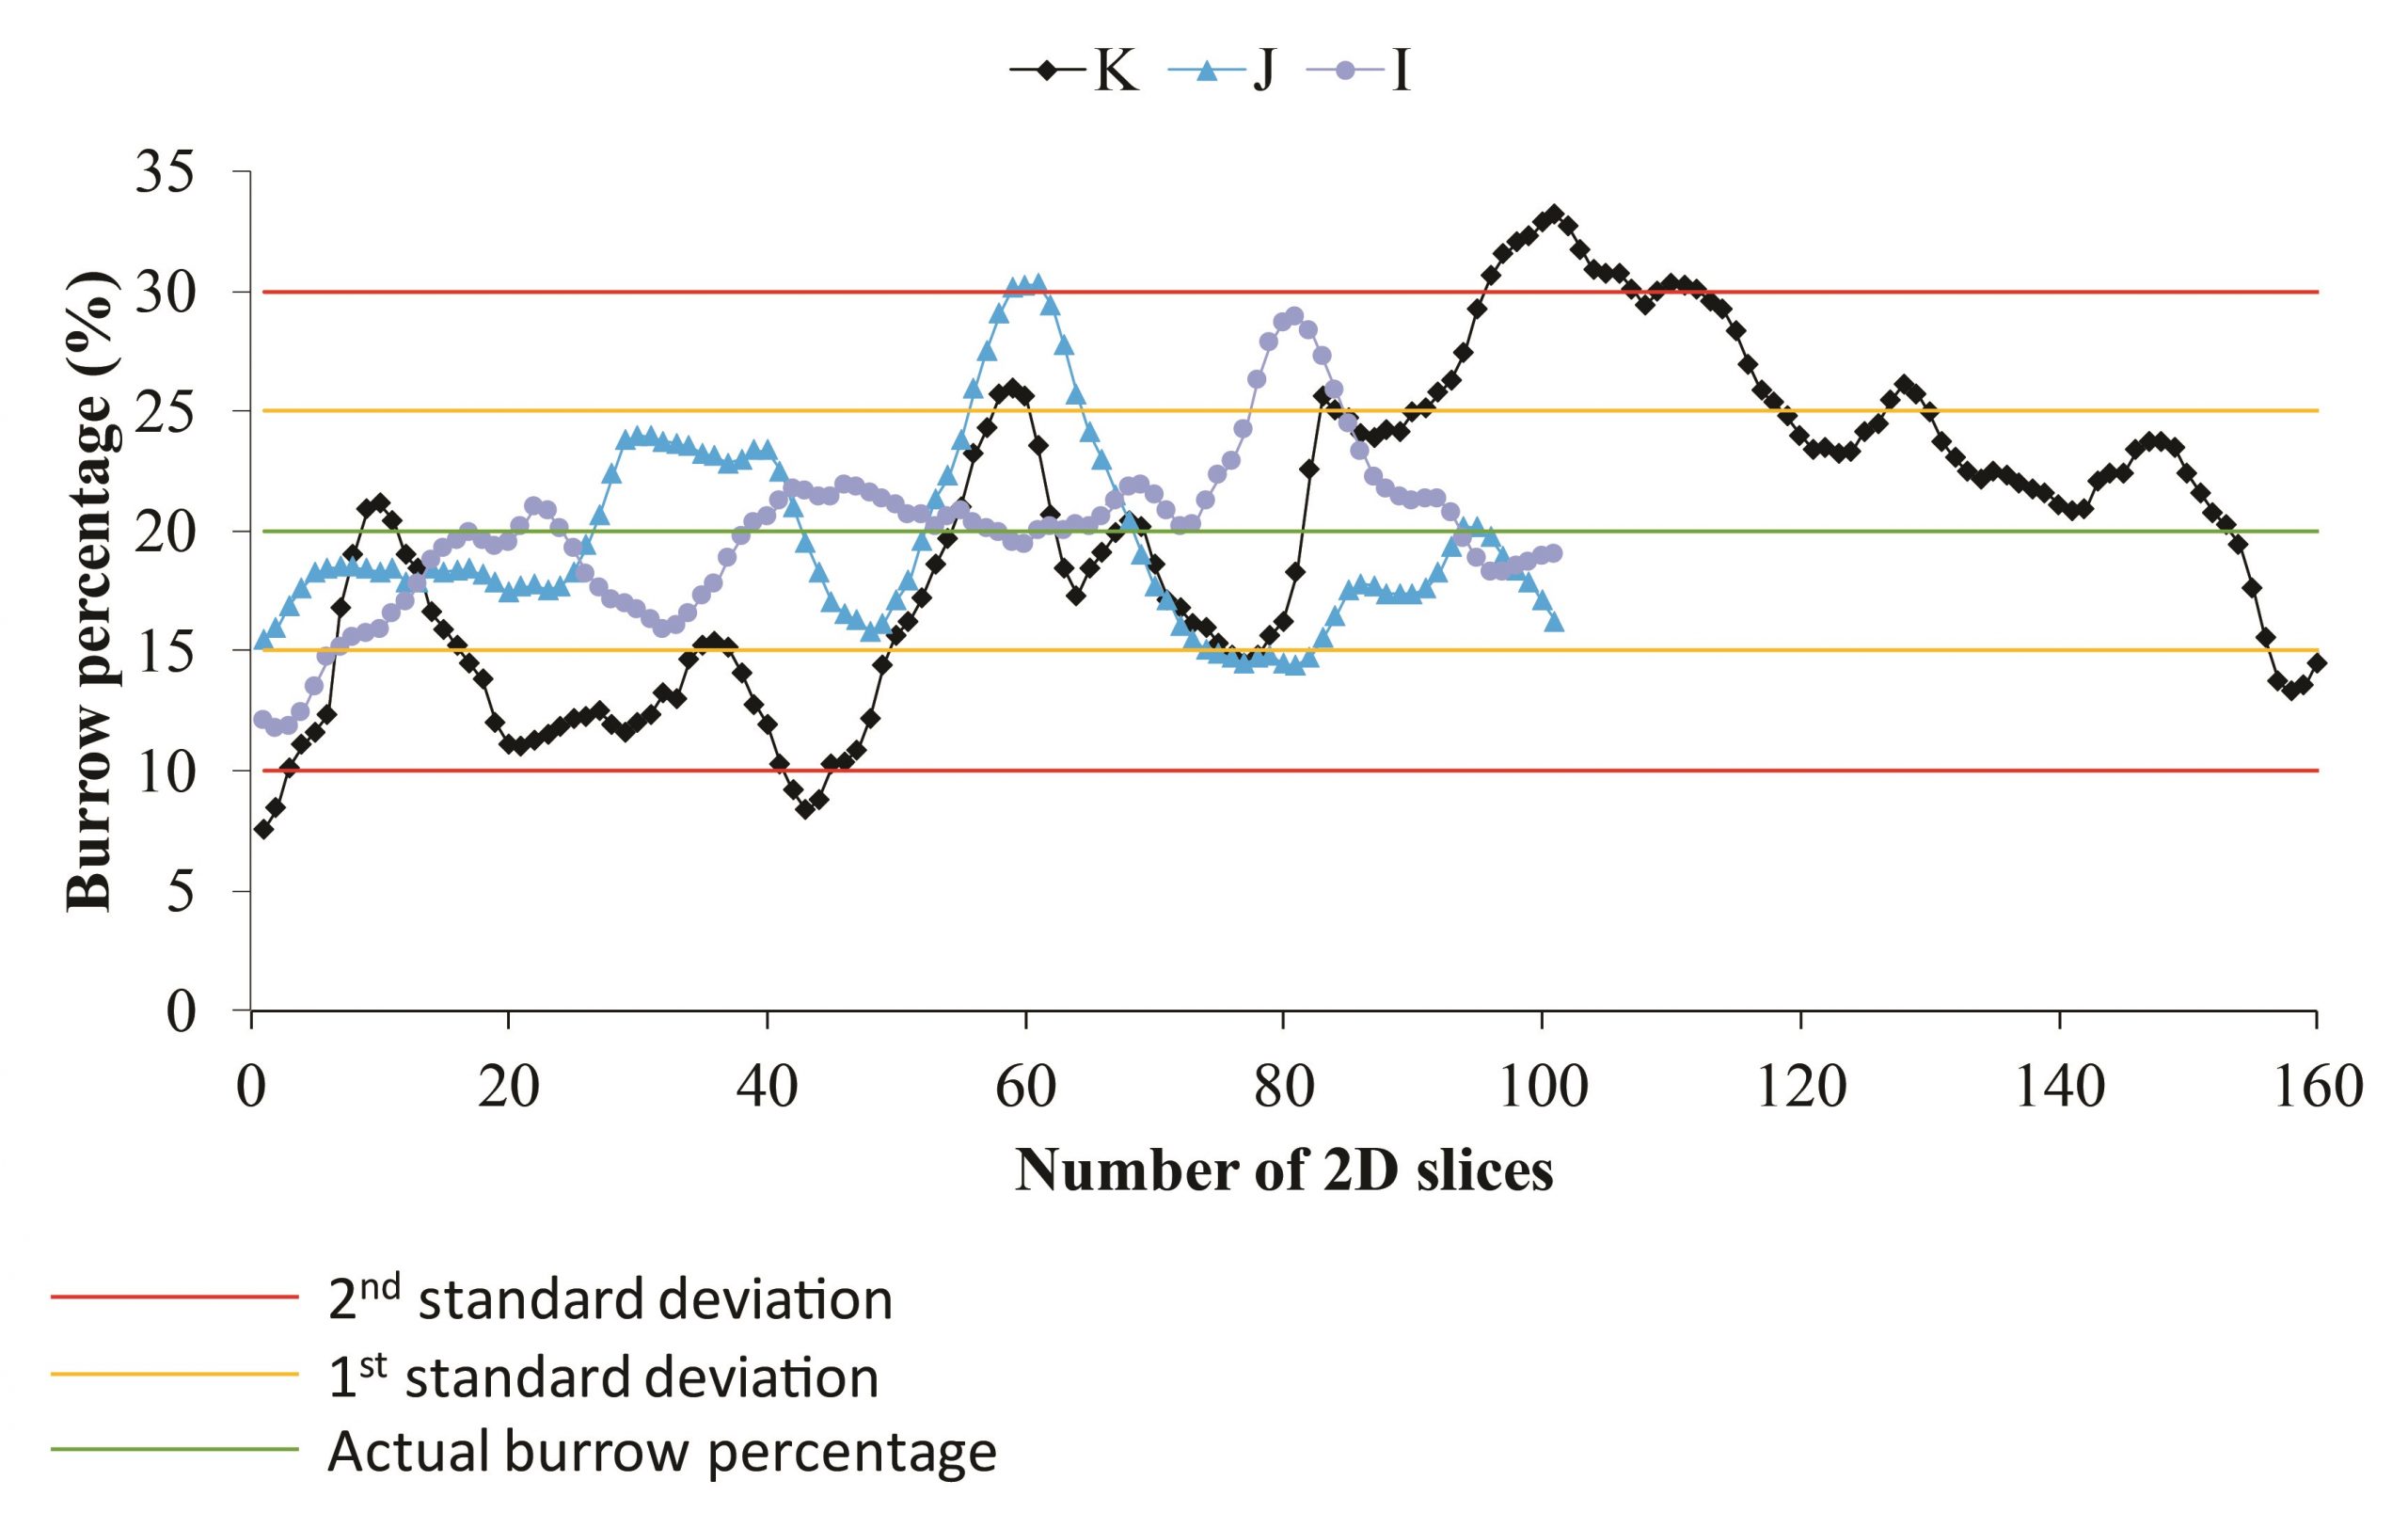
The customary approach of quantifying the burrow percentage in subsurface reservoirs is through semi-quantitative methods that investigate 2D views from core slabs, and thin sections which have limitation as they simplify the quantification of the complex 3D morphologies of Thalassinoides into 2D representation. Such limitations may result in errors when evaluating the actual burrow percentage in reservoirs and aquifers and, therefore, underestimating or overestimating their impacts on petrophysical properties. This study examines CT scans of a core cut from Thalassinoides-bearing strata (Hanifa Formation, central Saudi Arabia) to explore the quantitative variability in burrow percentage when estimated using 2D views. The results showed variability when estimating the Thalassinoides volume using one single 2D slice of the CT scans. A test of how randomly selected slices of the CT scan would represent the burrow percentage indicated that even five randomly selected slices could retain a mean comparable to the actual burrow percentage of the CT scan. Based on these results, the research group of Dr. Eltom suggested a statistical way to quantify the uncertainty associated with estimating the burrow percentage from 2D views, an important step toward a complete understanding of variability in burrow percentage (and bioturbation intensity) when estimated from 2D views.

Fig 2: Cross plot between burrow percentage calculated from 2D slices (different orientations I, J, and K) of the core and the number of these 2D slices in the CT scan of the core. Note that the value of the burrow percentage fluctuates around a mean value of approximately equal to 20.0% (green dot line), and the majority of the values fall within the first standard deviation, which approximately equals 5.0% (brown dotted lines).
References:
The following ISI journal papers were published by the team researchers as products of this project:
- Eltom, H.A. and Alqubalee, A.M., 2022. Quantitative variability of burrow percentage estimated from 2D views: example from Thalassinoides-bearing strata, central Saudi Arabia. Palaios, 37(2), pp.35-43 - https://doi.org/10.2110/palo.2021.012
