Detecting passive seismic events of lower magnitudes is increasingly in demand. It finds applications in mining and reservoir monitoring in Oil & Gas and Geothermal industries. Detecting and studying them, also, have always helped in seismic risk assessments that save lives and properties. However, as we seek to detect weaker and weaker events, the shortcomings of the well-known algorithms such STA/LTA (Allen 1978), template matching (Brown et al., 2008), become apparent.
Under the supervision of Dr. Umair bin Waheed, Mr. Ahmed Shaheen, an MS student at CPG has been working on using a convolutional neural network (CNN) for detecting low-magnitude earthquakes. Its unprecedented success in the field of computer vision encouraged its application in the detection of low-magnitude events. CNN has the edge over previously deployed automatic event detection techniques. It can deal with the non-linearity of the problem with much more flexibility. It can also detect events originating from various locations, unlike template matching techniques. Once trained, CNN is a computationally efficient method to deploy. It has an advantage over other machine learning techniques that it can extract features from training data on its own. The latter advantage makes it adapt easily to the complexity of the problem.
We attempt to detect low-magnitude seismic events in the Groningen Area, the Netherlands. The area suffered from frequent seismic events related to gas production from the area. Gas production throughout the decades led to reservoir compactions that caused frequent seismic events. Some events caused losses in many properties, panic, and rage among residents. The area has a dense seismological network that offers a great opportunity to study the problem thoroughly.
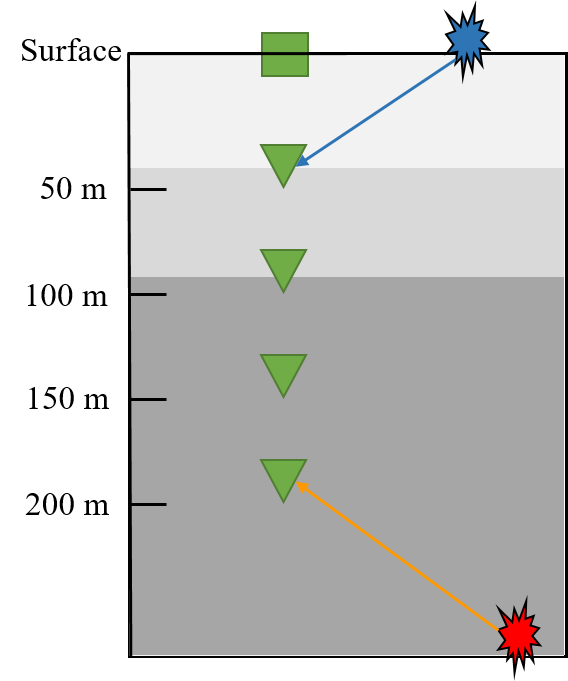
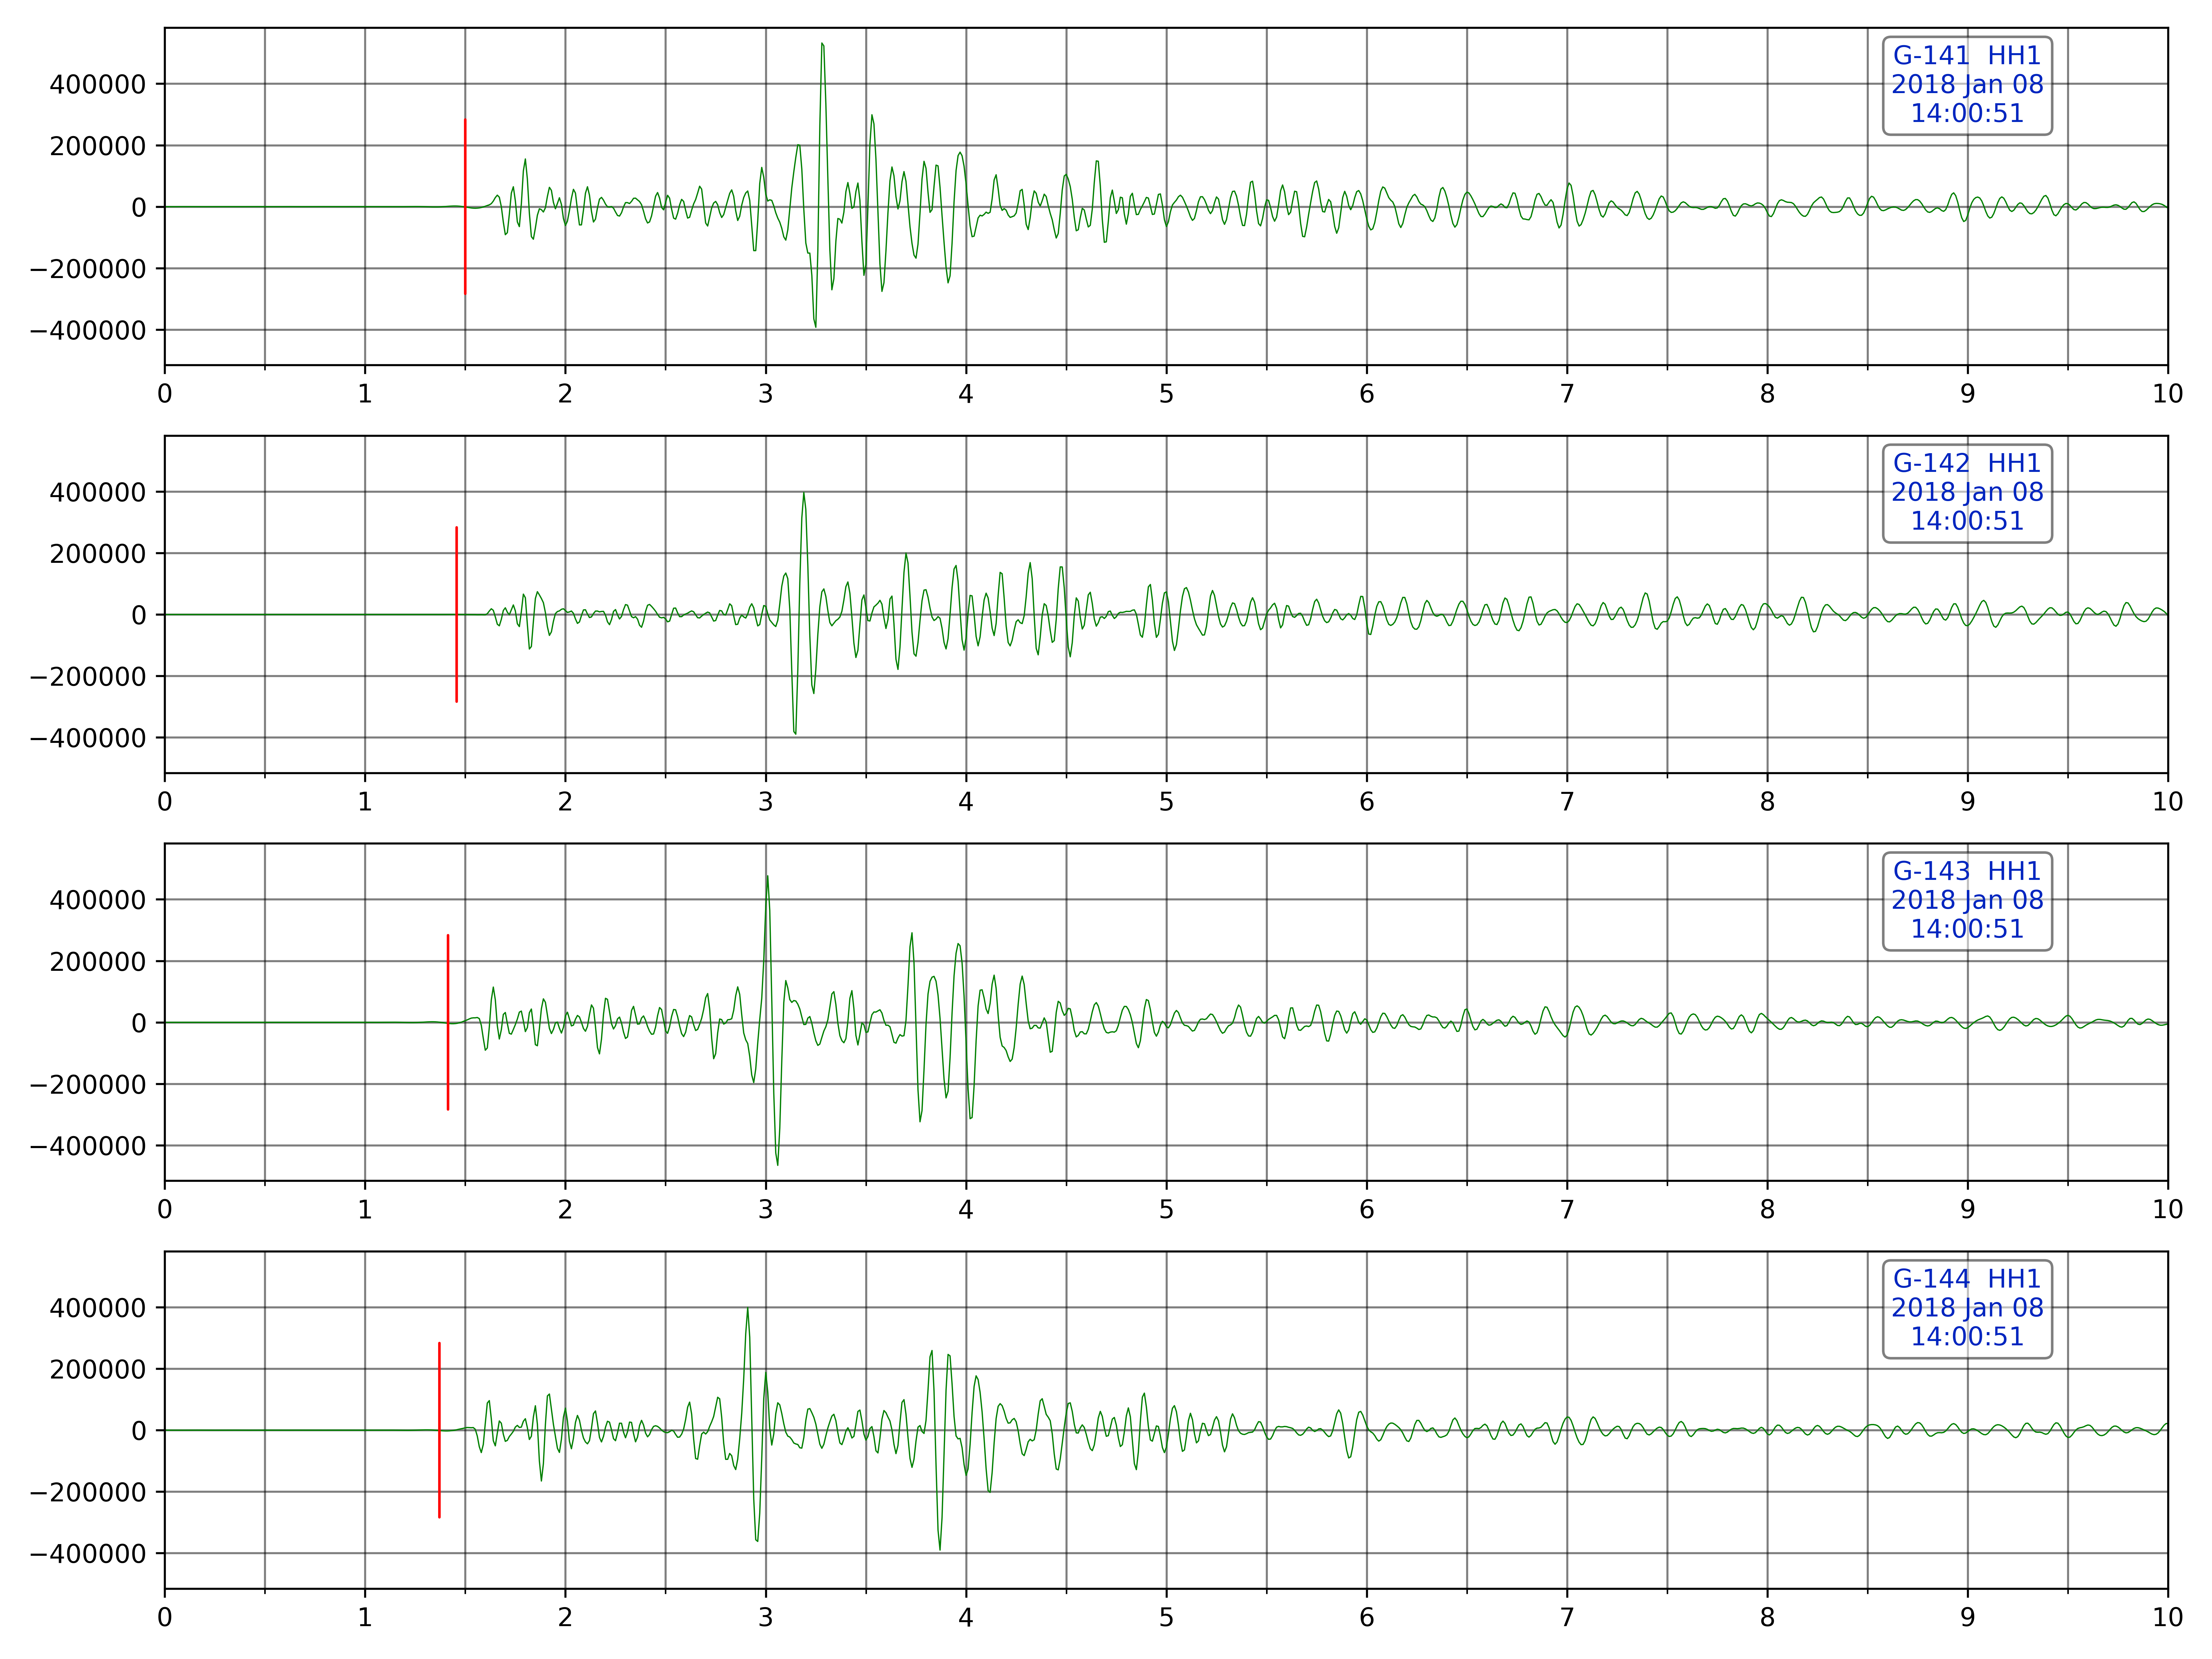
The Groningen seismic network has a special setup. Each station is a borehole station that consists of a surface accelerometer on the surface and 4 geophones in the borehole at depths 50, 100, 150, 200 meters (Figure 1). This setup allows an interpreter to differentiate between weak seismic events and noises coming from the above by observing the moveout pattern. A noise coming from above will arrive first on the uppermost geophone, while a genuine seismic event will be recorded at the lowermost sensor first. Figure 2 shows the moveout of a genuine event on the four levels of one of the stations.
CNN can recognize spatial features within the data. Therefore, instead of training the network on each geophone separately, the entire four levels of each station are fed as one training example. This allows the network to look at the four levels together and detect the aforementioned moveout patterns. This gives CNN more power in detecting low-magnitude events without giving many false alarms, i.e. making it more robust.
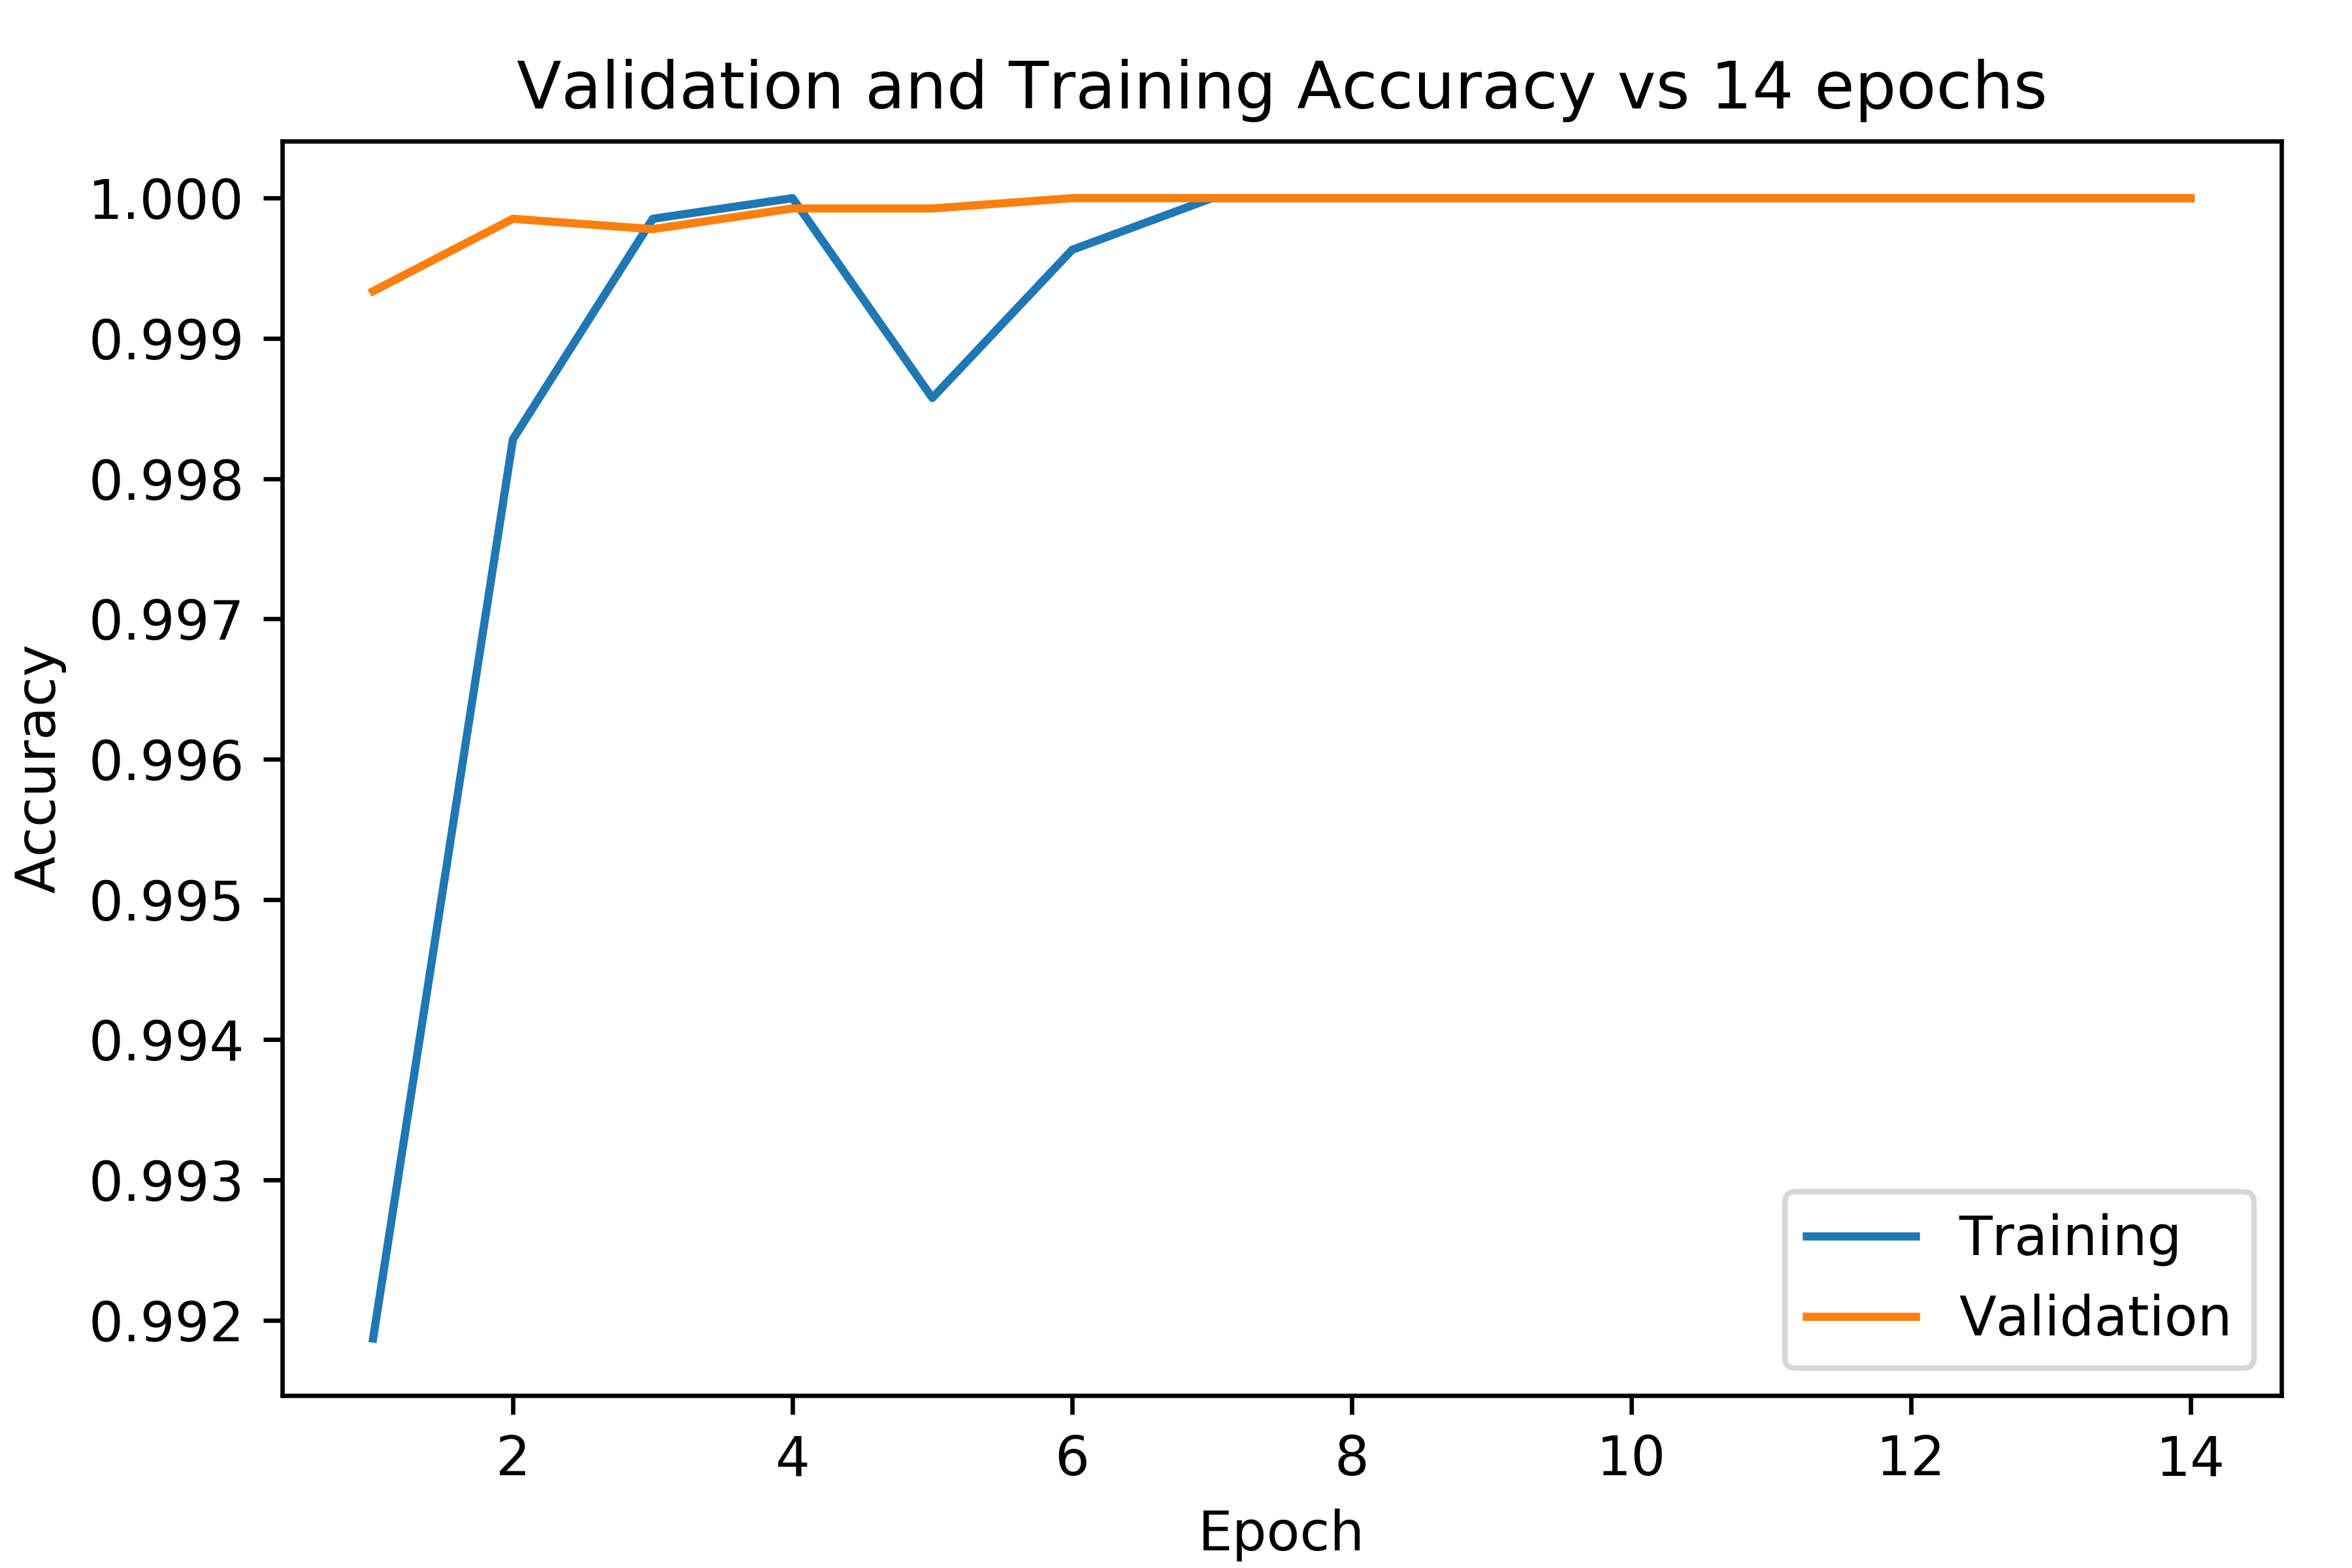
In our research, we trained a CNN on seismic records of cataloged events that occurred between October 2017 and February 2018 events. The training data was split into 60% training, 20% validation, and 20% testing. The network reached 100% accuracy on all datasets. Figure 3 shows the accuracy of the network vs training epoch.
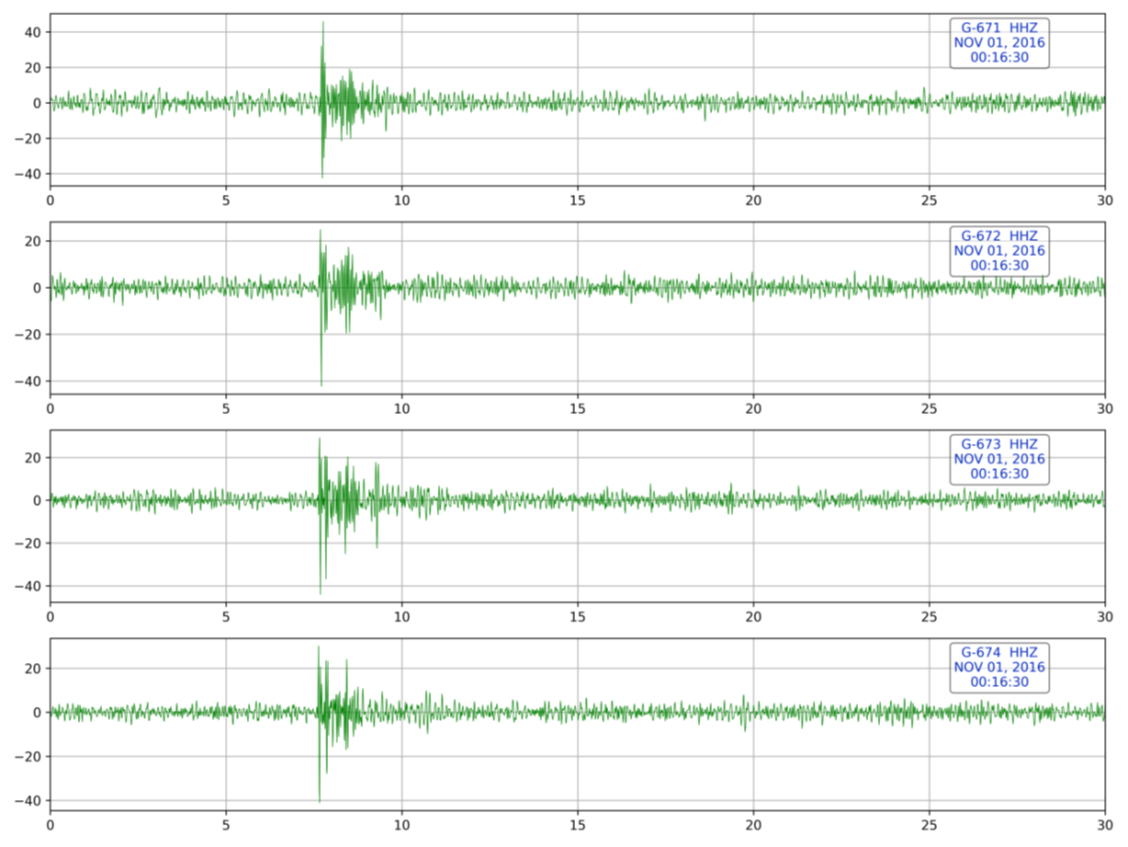
The network was then tested on four hours of continuous data that contained two cataloged events. It detected the two cataloged events plus 4 more events without detecting any false alarms. The new events were verified by other techniques as template matching. Figure 4 shows an example of one of the detected events. Its absolute maximum amplitude is 40 and yet was detected by the network.
These promising results encouraged further application. Currently, the network is tested over a two months period, December 2017 and January 2018. This period witnessed a major event that occurred on January 8. The target is to test if the network will detect minor foreshocks and aftershock.
Lowering the detection threshold of seismic events in a robust computationally effective technique is crucial for advancement in many areas. It allows seismologists to make use of the full potential of the ever-increasing seismic monitoring networks. It will allow its employment in monitoring reservoirs in oil & gas and geothermal industries. Enhancing monitoring provides a powerful tool in understanding and managing the subsurface operations better.

Figure 1 Schematic of a station. The green square represents the accelerograph at the surface & the triangles are the 4 velocity sensors at depths (50, 100, 150 & 200 m). Events (in red) arrive first at the deepest sensor, while noises (in blue) coming from the above arrive first at the shallowest sensor.

Figure 2 An example of the arrival-times moveout on one of the horizontal components of G-14 station during the Zeerijp event on January 8, 2018. Seismic energy arrives first at the deepest station and progresses upwards, indicating that the energy is coming from below.

Figure 3 Accuracy vs training epochs

Figure 4 Seismic records of Z-components of station G-67 for the event detected on the four-hours data of November, 1, at time-window 00:16:30.
References:
- Allen, R. V. (1978). Automatic earthquake recognition and timing from single traces. Bulletin of the Seismological Society of America, 68(5), 1521-1532.
- Brown, J. R., Beroza, G. C., & Shelly, D. R. (2008). An autocorrelation method to detect low-frequency earthquakes within tremor. Geophysical Research Letters, 35(16).
