There is a common assumption that deep-water environments are calm environments where muds settle from suspension. In the last few decades, with the advancing technology, scientists have documented that deep-water settings can show various depositional conditions and environments. Today, we know that there are several sediment transport parameters providing even coarse-grained (i.e., silt and sand) material into deep-waters via hyperpycnal flows, contourites, deep-water currents, etc. However, our knowledge about these parameters is still limited due to the inaccessibility and high cost of underwater research.
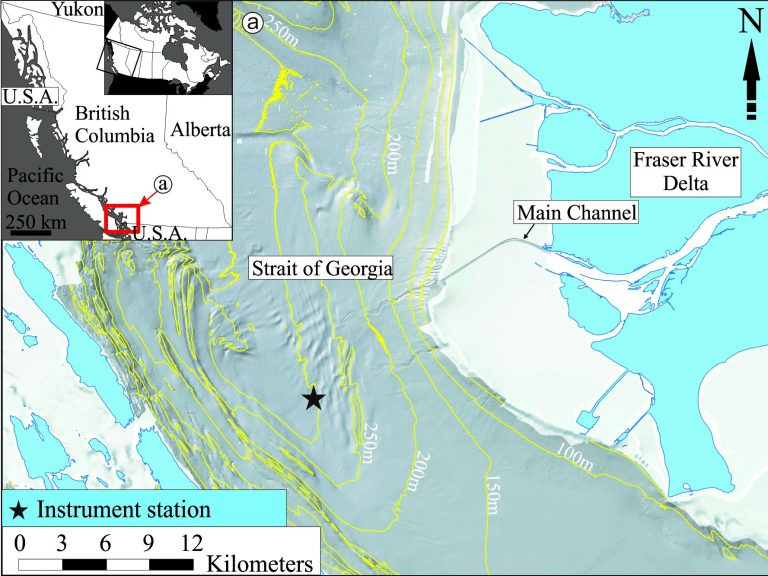
A team led by Dr. Korhan Ayranci and Dr. Shahin Dashtgard (Simon Fraser University, Canada) analyzed 11 years of real-time physical and chemical oceanographic properties (e.g., turbidity, ADCP, salinity, etc.), and showed episodic deep-water renewal (DWR) events in the Strait of Georgia, Canada (Fig. 1) using the ONC data set (https://www.oceannetworks.ca/). They then showed a video from 300 m water depth that recorded one of these events in action.

Figure 1. Bathymetric map of the Strait of Georgia off the Fraser River Delta and the position of the instrument station (black star). The inset map shows the position of the study area (red box) in Canada and British Columbia
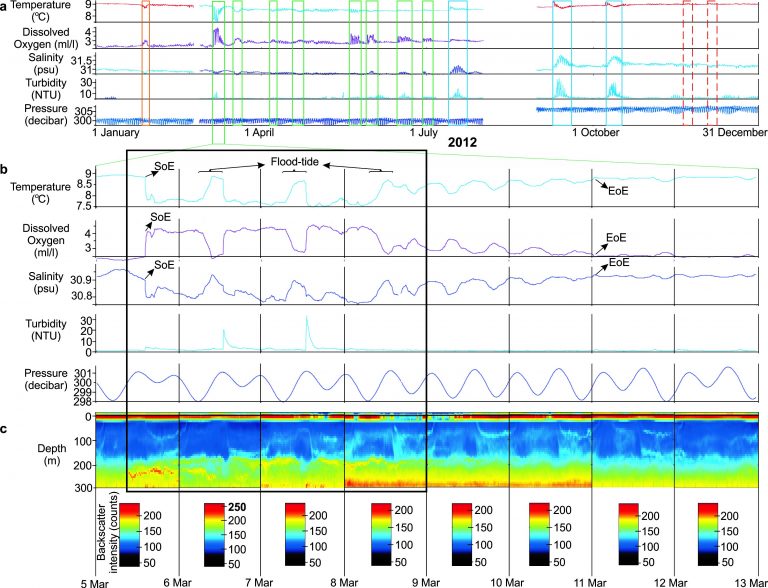
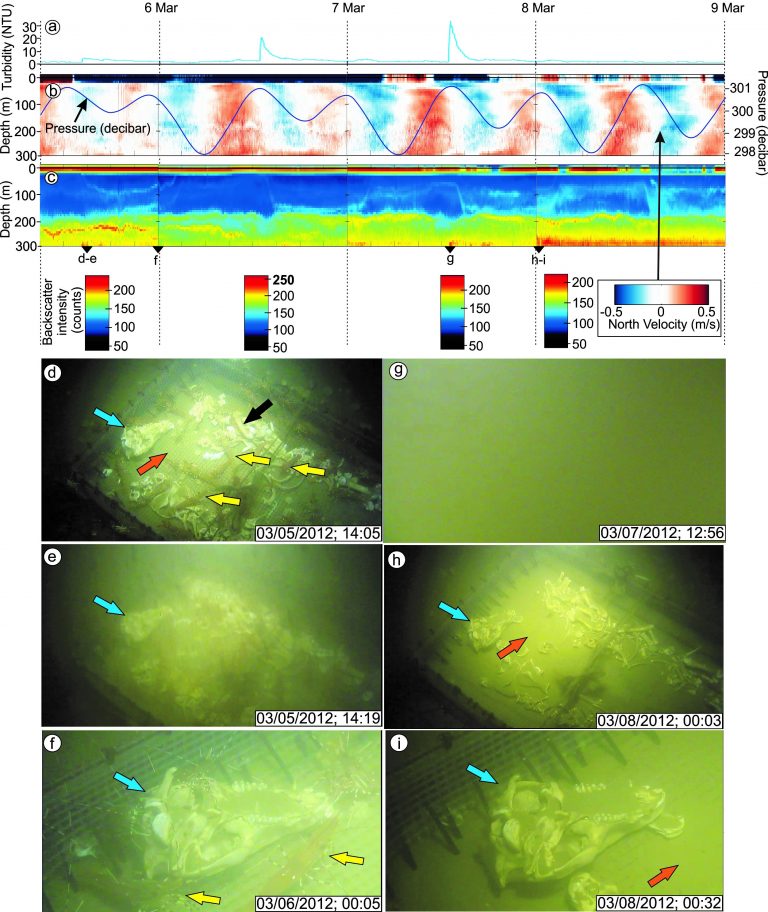
At least 6 DWRs occur per year at 300 m water depth and each event continues for over 3 days (Fig. 2). They initiate during neap tides and are associated with increased turbidity. In the spring, DWRs introduce cold, oxygenated and nutrient-poor waters, and in the fall they introduce warm, oxygen-depleted, nutrient-rich and saline waters. Each deep-water renewal event in the Strait of Georgia deposits approximately 1.5 cm of sediment (Fig. 3). Given that there are multiple events every year, annual sedimentation can reach up to 9 cm. This sedimentation rate makes deep-water renewals potentially one of the most important sediment transport mechanisms in straits and enclosed basins.

Figure 2. Oceanographic measurements from the central Strait of Georgia (300 m water depth) during the DWR0312 event that occurred between March 5 and 11, 2012. (a) Measurements for all of 2012 with DWRs indicated by the boxes. (b) Daily changes in seawater parameters during the DWR0312 event. (c) Acoustic backscatter intensity (counts) from the ADCP showing increased bottom water turbidity. Each day has its own ADCP color legend due to a significant increase in turbidity on March 6, 2012. SoE: start of event; EoE: end of event.

Figure 3. Physical and chemical variations and still images captured from video footage of the DWR0312 event. (a-c) Variations in physical oceanographic properties during the DWR0312 event. The black triangles at the bottom of c indicate the timing of video-image capture. (d-i) Video image captures from before and during the DWR0312 event. In all images, the blue arrow indicates the animal skull, the orange arrow indicates the mesh bottom of the cage and the yellow arrows point to shrimp. Please note that (f) and (i) are close up images of the skull that are located close to the edge of the cage. The camera at 300 m was originally installed for a forensic investigation testing decomposition rates of animal carcasses in deep water.
This work is novel in that it is the first study that visually demonstrates deep-water renewals. Given that deep-water renewals are common in other straits and fjords, our conclusions provide world-wide applications. We believe that this work marks a significant step forward in identifying deep-water renewal events and will be of broad appeal to scientific community.
Link to the video showing one of these events in act (Supplementary Video S1): https://www.nature.com/articles/s41598-020-63123-3#Sec14
References:
Ayranci, K. and S. E. Dashtgard (2020). "Deep-Water Renewal Events; Insights into Deep Water Sediment Transport Mechanisms." Scientific Reports 10(1): 6139. Link
Ayranci, K., et al. (2012). "Tide-supported gravity flows on the upper delta front, Fraser River delta, Canada." Marine Geology 326–328(0): 166–170.
Masson, D. (2002). "Deep Water Renewal in the Strait of Georgia." Estuarine, Coastal and Shelf Science 54(1): 115-126.
