EM and Gravity methods
Characterizing a carbonate or clastic reservoir with surface geophysical methods has always been very difficult. This is mostly because the most common geophysical method (seismic) is based on acoustic velocities, and, within carbonate rocks, only very little information gets scattered back to the surface.
The Geophysics Research team are proposing the integrated use of electromagnetic methods in a tensor mode with gravity and microseismic measurements that allows imaging of fluids in carbonates. Since fluids resides in carbonates that are mostly fractured, we will then combine electromagnetic models with density models from gravity measurements and obtain an additional degree of targeting porosity and thus fluid variations in the reservoir (Strack et al., 1991, 2013; Kalisperi et al., 2018; Rani et al., 2020).
The electromagnetic measurements use the Earth electromagnetic field and its variation. Natural (passive) electromagnetic measurements can be acquired by the magnetotelluric method. Active (Controlled Source) EM measurements using EM source, which has a slightly higher sensitivity, can also be obtained. Usually, the controlled source measurements are collected during the day and the magnetotelluric signal during the night (to avoid the natural noise).
Fluids occupy and move through the secondary porosity (fractures) in carbonates and are highly interpretative (cause significant signal changes) from electromagnetic data and can indirectly determine the fracture pattern in the reservoir. A combination of seismic and electromagnetics can define the reservoir boundaries and its internal inhomogeneity based on fluid content and flow pattern. Using tensor measurements and 3D anisotropic models, the preferred fluid pathways (i.e., fractures) and the permeability can be identified. Thus, CSEM methods (integrated with other geophysical data) are vital for characterizing and monitoring a complex carbonate reservoir to improve the recovery factor. Currently, CPG, in collaboration with KMS technologies, USA, apply an innovative EM acquisition architecture that combines modern technologies acquiring surface and borehole data with high accuracy and reliability. The borehole measurements (using a shallow borehole EM sensor with magnetic, electrical, and 3C seismic/geophone sensor mounted) were included in the scheme since they will be used to calibrate the surface data to real reservoir scale and parameters.

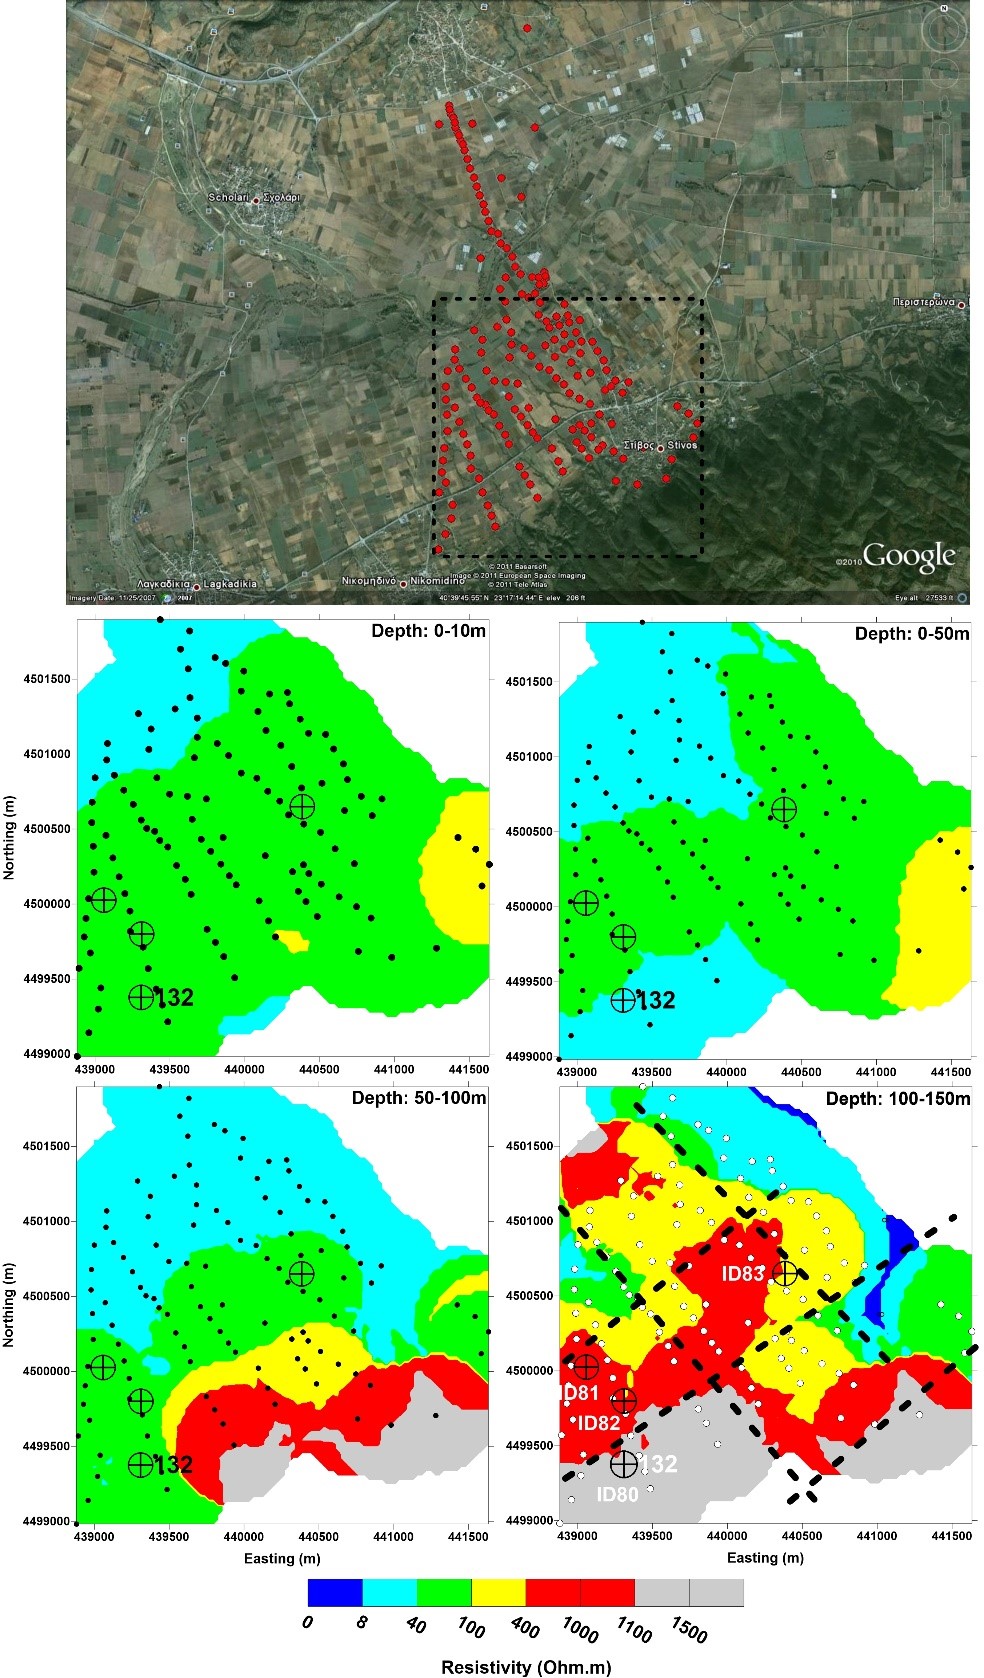
Figure 1 3D interpretation of TEM measurements collected in the Southern part of the study area is presented. Four different depth slices (0-10 m, 0-50 m, 50-100 m, and 100-150 m) are depicted. The location of the TEM soundings are shown.

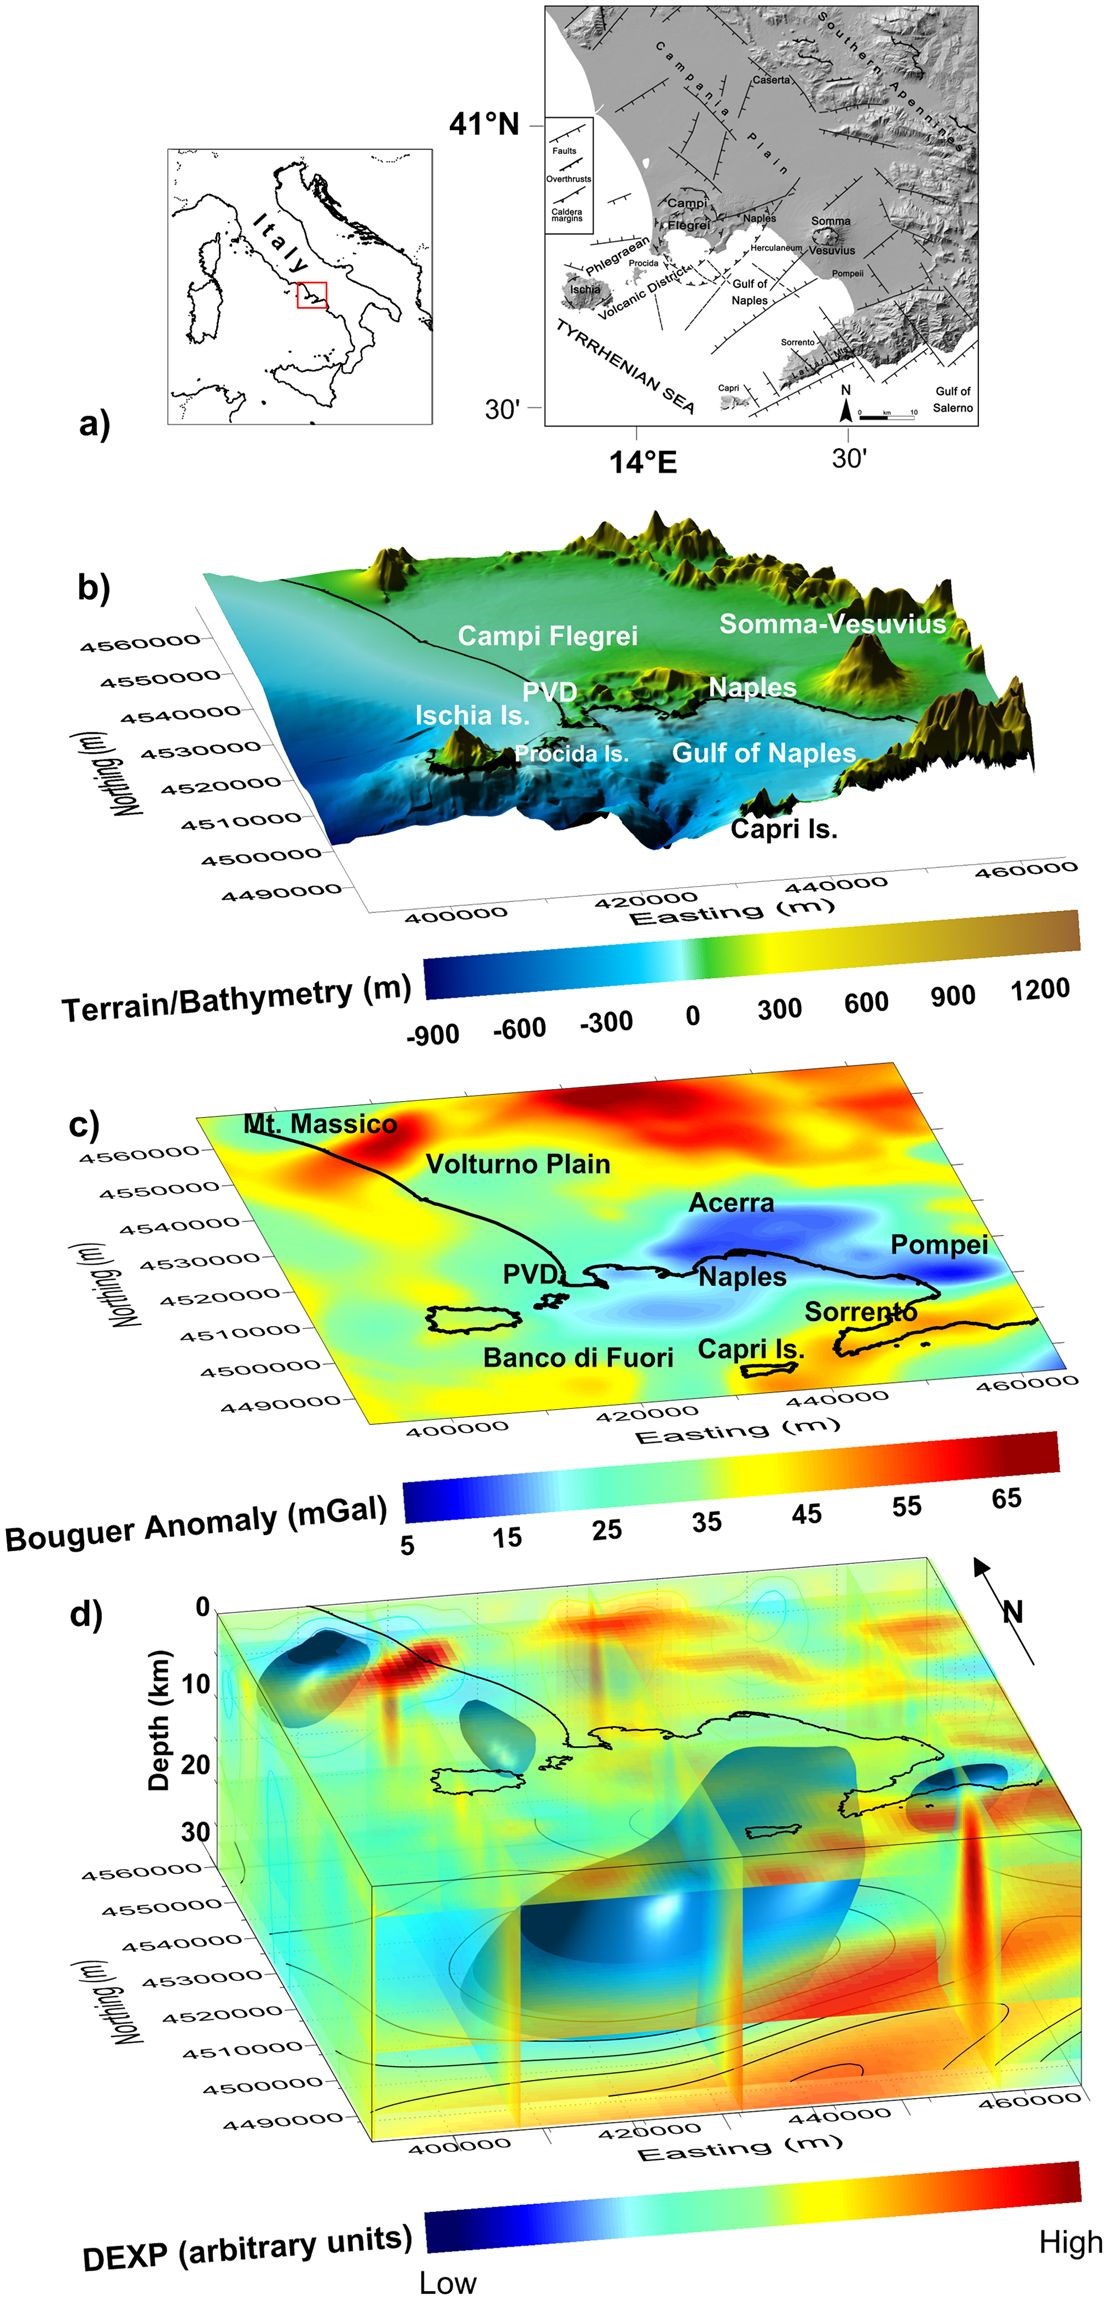
Figure 2 Gravity anomaly features of the Campania Active Volcanic Area: (a) Location of the study area (modified after)13. (b) Digital Terrain Model. (c) Detrended gravity anomaly map. (d) DEXP image of the sources of the anomalies.
Gravity measurements may allow the description of different characteristics of a reservoir (Fedi et al., 2018, Figure 2). From gravity measurements over a specific area, local structural traps, stratigraphic traps, or fluid movement in the reservoir can be inferred if sufficient density contrast exists between the geologic feature of interest and the surrounding rocks. The differences in gravitational field measurements are determined by rock mass and depth of sources/structures. The surface-gravity technique can be applied to any field, depending on reservoir thickness, size, depth, porosity, and density contrast between the fluids. Rock and fluid density contrasts determine the response. A gravity data survey is generally less expensive but has less resolving power than a seismic exploration survey. The University of Naples in Italy in collaboration with CPG-KFUPM have apply methods to analyze the gravity field at many scales (Fedi, 2002), providing maps of extremely rich and articulated structural lineaments at various scales and different depth without resorting to standard filter separations, but simply enhancing the effects at a given scale (which normally are possibly obliterated by those at other scales). Thus, an insightful representation of the structural features of a given area is obtained. This is critical for planning new wells and for simulating/forecasting the reservoir production
Data Integration
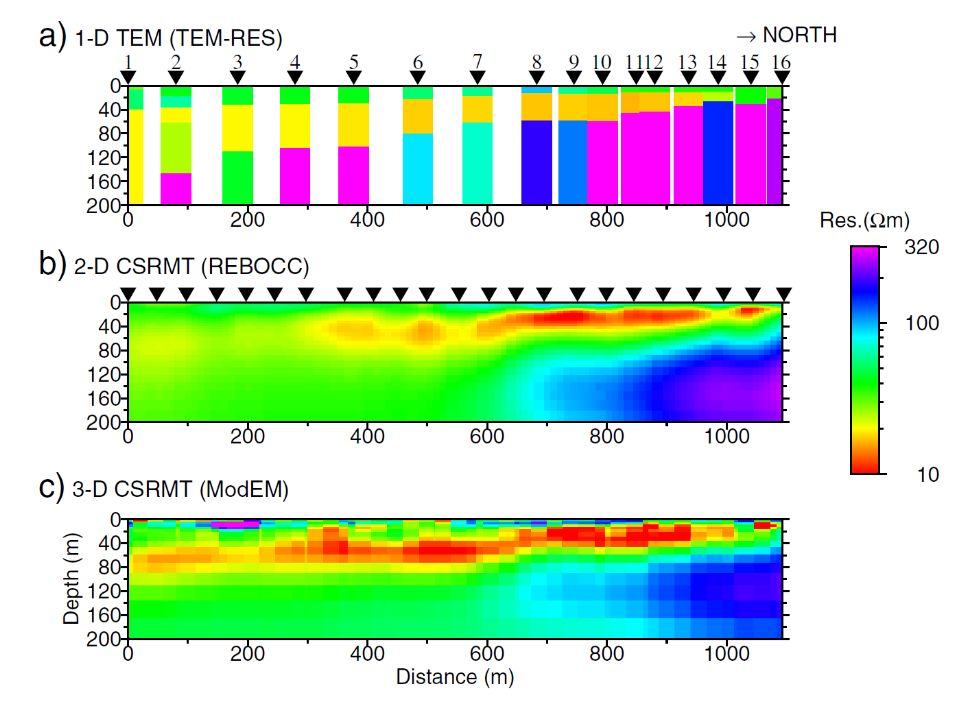
A critical component of the proposed reservoir characterization and monitoring is data integration to find the most realistic model (Strack et al., 1991; Hordt et al. 1992; Vafidis et al., 2014; Autio et al., 2016; Demirci et al., 2017; Massa et al., 2018; Passalacqua et al., 2018; Varfinezhad et al., 2020). This includes 3D modeling as the most crucial tool but also various inversion and joint inversion methods (Autio et al., 2016, Figure 3).

Figure 3 Inversion results from Profile 1; (a) TEM 1-D TEM-RES (site by site), (b) CSRMT 2-D REBOCC and (c) CSRMT 3-D ModEM.
The integration of geophysical data is aimed at expanding the links between different types of observations and measurements with the source model, to reduce uncertainties and improve the decision process. The joint interpretation of different datasets can be realized through different approaches that can be summarized as follows:
- Co-rendered images of different model parameters, such as conductivity and density, can be used for a sort of ‘level-zero’ geophysical integration.
- Constrained inversion: in this approach, the most robust dataset available is commonly used for constraining or driving the inversion of data characterized by a higher level of uncertainty.
- A more sophisticated approach based on cooperative inversion works better in complicated geophysical settings and is characterized by an iterative and interactive nature.
- The obtained geophysical data can also be used for a joint interpretation through machine learning algorithms, to minimize the interpretation risk and of achieving an improved understanding of the complex dynamics occurring in the area.
- The most complex method of integrating different datasets is simultaneous joint inversion. In this case, a composite (or joint) cost function, including the misfit between observed and predicted values for two or more independent datasets (e.g., electromagnetic and gravity) is minimized.
Enhanced Oil Recovery and Flood-Front Monitoring
The same combination of methods can be applied for flood-front monitoring. Improving the recovery factor is a crucial challenge in almost every oil field. Today, only limited technology exists from inside the wellbore, making thus mapping water/oil distribution difficult and expensive. Different fluids were tested to optimize the EOR process (WAG and others) and improve the reservoir oil recoveries as part of the enhanced oil recovery (EOR) process. Based on the fluids used for EOR, the electromagnetic geophysical method is one of the best options for monitoring (based on the depth of investigation and to the sensitivity of the technique to fluid changes) and if it is combined with borehole seismic and microseismicity measurements (which predominantly responds to structural changes), then the maximum of the information from the data integration will be revealed.
Dynamic fluid-flood monitoring can easily improve the recover factor by 20-30% in addition to the reduction of operational and development costs. As mentioned above, the best choice of method for direct fluid movement is electromagnetics, as practiced in borehole logs and analyzed in the previous section. The EM, combined with gravity measurements, will allow the imaging of the fluids in the carbonates.
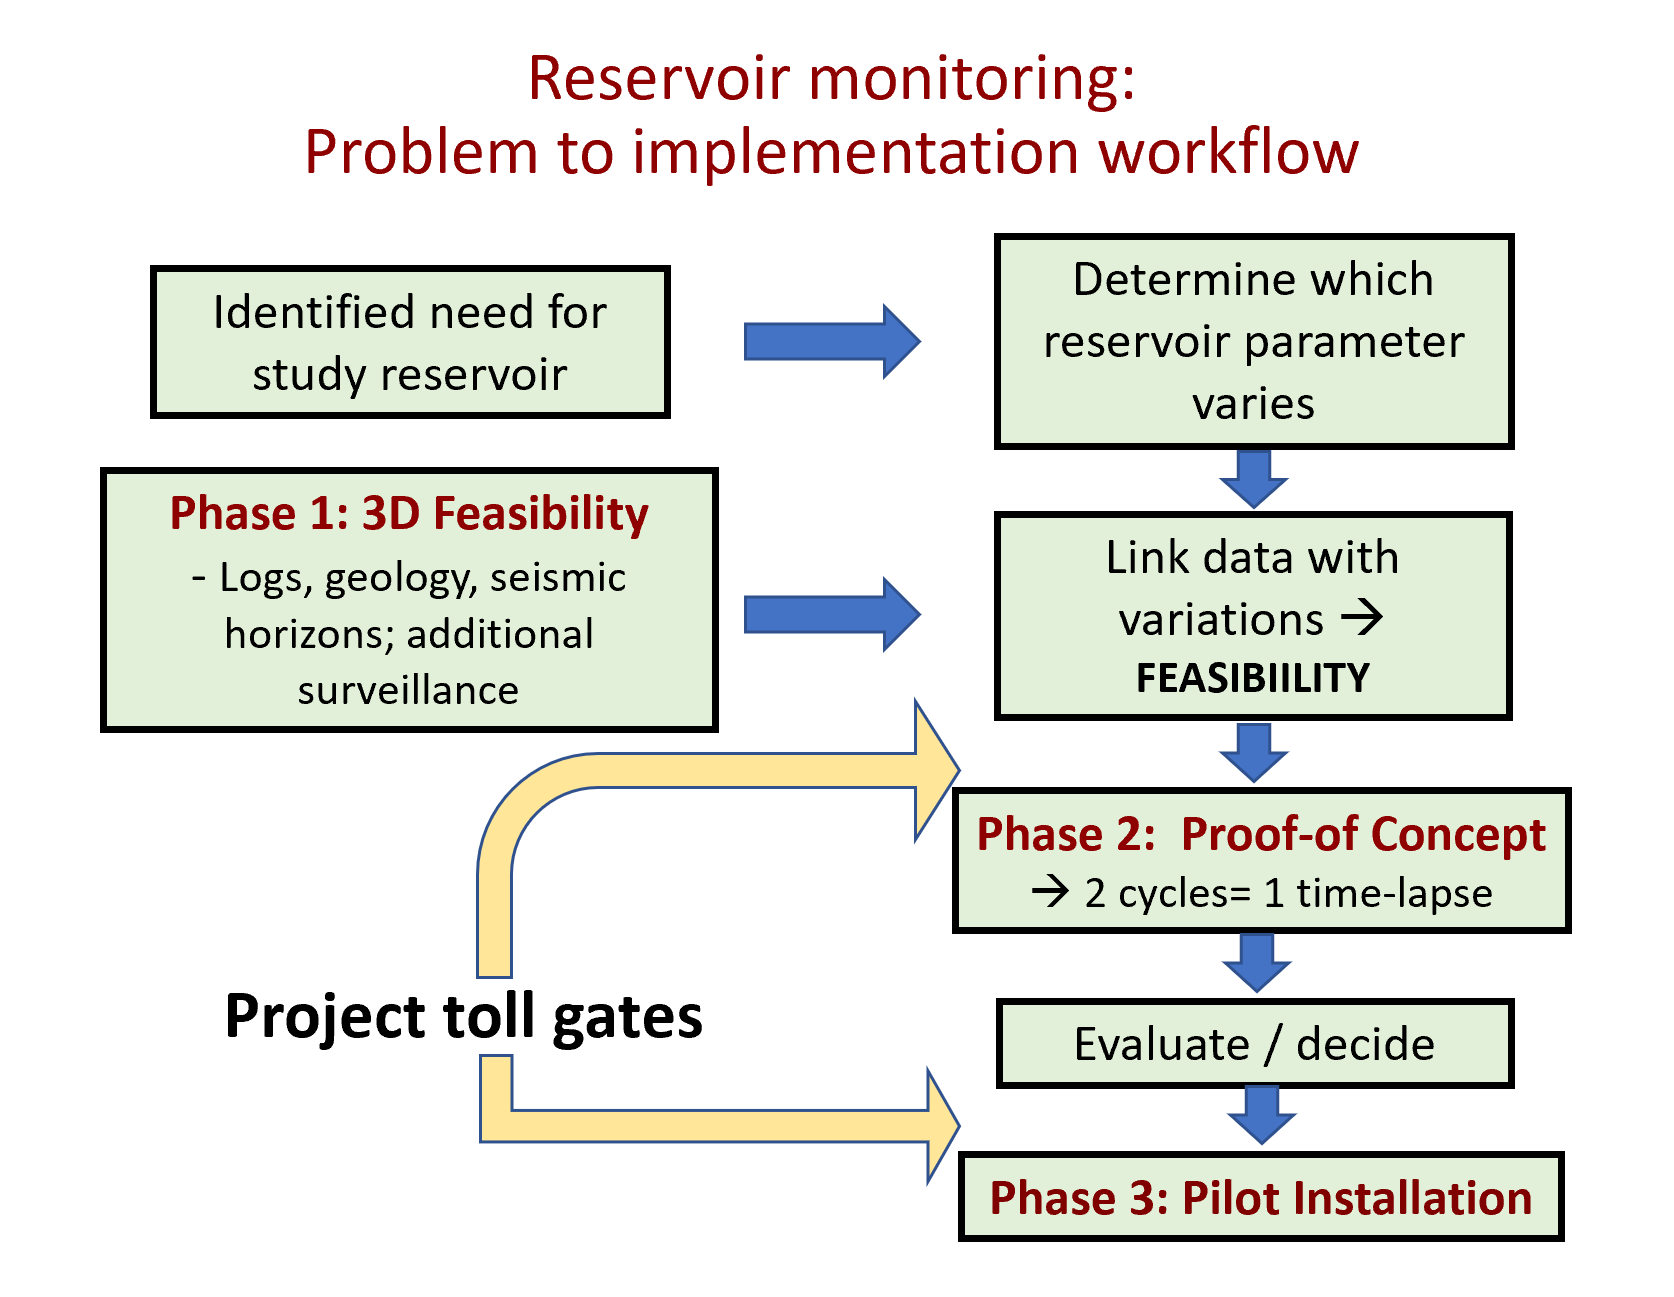
A monitoring project is usually divided into 3 phases, where each phase ends with a detailed plan for the next phase (Figure 4).
Phase 1: 3D Feasibility
Phase 2: Proof-of-concept (Can we see reservoir parameter variations?)
Phase 3: Field Pilot

Figure 4 Workflow for the reservoir monitoring project, including all their phases.
Based on the different phases, ee expect to be able to map porosity/permeability variations in carbonate rock, integrate it with other geoscientific information, and increase the in-fill drilling success ratio significantly. This would yield a production rate by reducing the total cost at around 30-50%.
Research Team
The team at CPG-Geophysics Program research group includes Dr. Pantelis Soupios, Dr. SanLinn Kaka, Dr. Panagiotis Kirmizakis and Dr. Markos Tranos.
References:
- Autio U, MY Smirnov, A Savvaidis, P Soupios, M Bastani, 2016, Combining electromagnetic measurements in the Mygdonian sedimentary basin, Greece, Journal of Applied Geophysics, S0926-9851(16)30414-1, doi: 10.1016/j.jappgeo.2016.10.014
- Di Massa Domenico, Maurizio Fedi, Giovanni Florio, Andrea Vitale, Andrea Viezzoli, Vlad Kaminski, 2018, Joint interpretation of AEM and aeromagnetic data acquired over the Drybones kimberlite, NWT (Canada), Journal of Applied Geophysics, v. 158, pp. 48-56.
- Demirci İ, ME Candansayar, A Vafidis, P Soupios, 2017, Two Dimensional Joint Inversion of Direct Current Resistivity, Radio- Magnetotelluric and Seismic Refraction Data: An application from Bafra Plain, Turkey, - Journal of Applied Geophysics, doi:10.1016/j.jappgeo.2017.03.00
- Fedi M., F. Cella, M. D’Antonio, G. Florio, V. Paoletti and V. Morra, 2018, Gravity modeling finds a large magma body in the deep crust below the Gulf of Naples, Italy, Scientific Reports volume 8, Article number: 8229 (2018)
- Hördt, A., Strack, K. M., Vozoff, K., Wolfgram, 1992, Resolving resistive layers using joint inversion of LOTEM and MT data, in: Vogel, A., Gorenflo, R., Kummer, B., Ofoegbu, C.O. (eds.), Inverse Modeling in Exploration Geophysicists, Proceedings of the 8th International Mathematical Geophysics Seminar, Vieweg, 147-150.
- Kalisperi Despina, Maria Kouli, Filippos Vallianatos, Pantelis Soupios, Stephen Kershaw, Nikos Lydakis-Simantiris, 2018, A Transient ElectroMagnetic (TEM) Method Survey in North-Central Coast of Crete, Greece: Evidence of Seawater Intrusion, Geosciences, vol. 8(4)
- Payal Rani, Pantelis Soupios and Pavel Barsukov, 2020, Regional tectonic model of Southern, Central part of the Mygdonian basin (Northern Greece) by applying 3D Transient Electromagnetic Modeling, Journal of Applied Geophysics, https://doi.org/10.1016/j.jappgeo.2020.104008
- Passalacqua, H., S. Davydycheva, and K. Strack, 2018, Feasibility of multi-physics reservoir monitoring for Heavy Oil, Heavy Oil Conference Kuwait, SPE-193690-MS.
- Strack, K. M., Hördt, A., Vozoff, K., and Wolfgram, P.A, 1991, Integrated electromagnetic and seismic methods for petroleum exploration, Exploration Geophysics 22, 375 378.
- Strack, K.M., and Aziz, A.A., 2013, Full Field Array ElectroMagnetics for hydrocarbon reservoir exploration and monitoring, Geohorizons (Special Issue on Shale Gas), 18, 32-43.
- Varfinezhad Ramin, Behrooz Oskooi, Maurizio Fedi, 2020, Joint Inversion of DC Resistivity and Magnetic Data, Constrained by Cross Gradients, Compactness and Depth Weighting, Pure and Applied Geophysics, pp. 1-19.
- Vafidis, P. Soupios, N. Economou, H. Hamdan, N. Andronikidis, G. Kritikakis, G. Panagopoulos, E. Manoutsoglou, M. Steiakakis, E. Candansayar and M. Schafmeister, 2014, Seawater intrusion imaging at Tybaki, Crete, using geophysical data and joint inversion of electrical and seismic data, First Break, Vol. 32, August 2014, pp. 107-114.
